



The purchase price of a GPU does not tell you what AI actually costs. Cost per token measures how much you spend to process or generate a unit of AI output, which makes it a more useful way to compare cloud APIs, GPU rentals, neocloud capacity, owned infrastructure, and hybrid deployments.
The calculation should include more than GPU cost. Utilization, power, cooling, networking, storage, software, support, financing, operations, and residual hardware value can all change the result. Input and output tokens should also be tracked separately because their cost and workload behavior can differ.
For infrastructure leaders, the practical question is no longer simply, “What does this GPU cost per hour?” It is: “What does it cost us to produce useful AI output at the performance and service level our workload requires?” AMD now uses token volume, total cost of ownership, monthly run rate, and break-even analysis to compare cloud, local, and hybrid AI economics.
Key Takeaways
- Cost per token connects infrastructure spending to useful AI work. GPU purchase price or GPU-hour cost alone cannot show how efficiently a system turns compute into model output.
- Utilization can change the economics more than acquisition price. Underused GPUs spread fixed infrastructure costs across fewer tokens.
- Input and output tokens should not be treated as identical. API providers may price them differently, while prompt processing and token generation also place different demands on inference systems.
- Training and inference need separate cost models. Training tends to involve planned, throughput-focused jobs, while production inference must handle ongoing traffic, latency, concurrency, and changing demand.
- True cost per token is a TCO metric. Power, cooling, networking, software, support, financing, operations, idle capacity, and residual value belong in the calculation.
What Does Cost per Token Mean?
A token is a small unit of information that a language model processes. A token may be a full word, part of a word, punctuation, or another text fragment. Token counts vary by model, language, and tokenizer.
Cost per token is the amount an organization spends to process or generate those tokens.
At its simplest:
Cost per token = Total AI workload cost ÷ Total tokens processed
Because the number becomes very small, infrastructure teams will usually find cost per 1 million tokens easier to use:
Cost per 1M tokens = (Total workload cost ÷ Total tokens) × 1,000,000
This metric gives finance and infrastructure teams a common unit for comparing different ways to run the same workload.
It also moves the discussion beyond the accelerator. A production AI system depends on servers, memory, storage, networking, software, facilities, and operations. That broader cost structure is why enterprise AI infrastructure beyond the GPU matters when building a realistic token-cost model.
Cost per Token vs. Cost per Compute or GPU-Hour
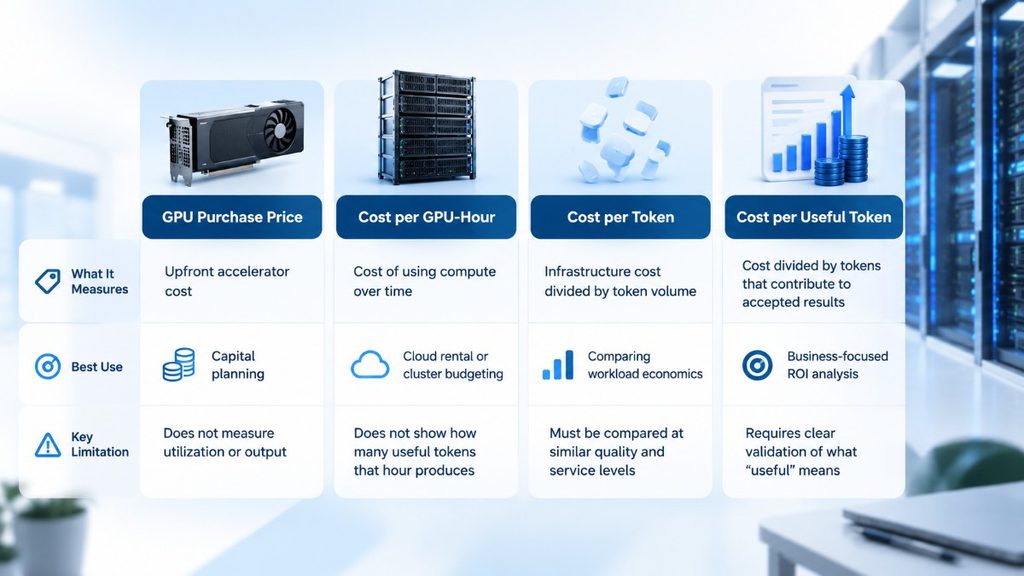
GPU-hour cost answers a useful but limited question: How much does one hour of accelerator capacity cost?
Cost per token asks a different question: How much useful AI work do we receive from that spending?
| Metric | What it measures | Best use | Main limitation |
| GPU purchase price | Upfront accelerator cost | Capital planning | Does not measure utilization or output |
| Cost per GPU-hour | Cost of using compute over time | Cloud, rental, or cluster budgeting | Does not show how many useful tokens that hour produces |
| Cost per token | Infrastructure cost divided by token volume | Comparing workload economics | Must be compared at similar quality and service levels |
| Cost per useful token | Cost divided by tokens that contribute to accepted workload results | Business-focused ROI analysis | Requires the organization to define what “useful” means |
Two systems can have very different economics even when the cheaper one has a lower GPU-hour rate.
Consider a simplified example.
- System A costs $2 per GPU-hour and produces 2,000 output tokens per second.
- System B costs $3 per GPU-hour and produces 4,000 output tokens per second.
Using those illustrative assumptions, System A costs about $0.28 per million output tokens, while System B costs about $0.21 per million output tokens.
System B costs 50% more per GPU-hour, yet its token cost is lower because it produces more output during that hour.
This is why hardware evaluation should begin with the workload rather than the price tag. Factors covered in enterprise GPU assessment and buying criteria including memory capacity, model requirements, scaling, software support, and the surrounding platform can change the economics after the GPU is installed.
Important: this example is an illustrative model, not a performance claim for any specific GPU.
Why Cost per Token Matters More Than Raw GPU Cost
Raw GPU cost tells you what capacity costs to acquire. It does not tell you how efficiently that capacity works.
A lower-priced accelerator may become the more expensive option if it causes:
- lower model throughput;
- more GPUs to meet the same demand;
- longer job times;
- lower batch efficiency;
- memory constraints;
- higher power use per completed task;
- poor utilization;
- extra software or engineering work; or
- higher infrastructure costs elsewhere in the stack.
The reverse can also be true. The newest or fastest GPU may provide excellent peak performance but still be hard to justify for a workload that cannot use that performance.
The useful comparison is therefore not cheap GPU versus expensive GPU. It is cost of acceptable workload output versus cost of acceptable workload output.
Quality matters here. A low cost per token is not a win if the model misses the required accuracy level, latency target, context size, or reliability goal.
How to Calculate Cost per Token
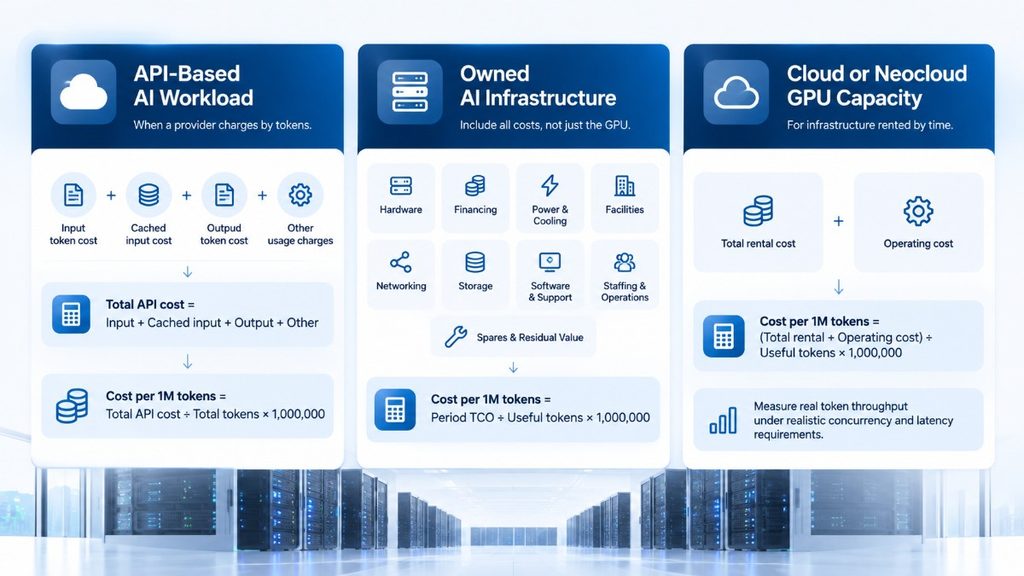
The right formula depends on how the workload is deployed.
For an API-Based AI Workload
When a provider charges by tokens, start with:
Total API cost = Input-token cost + Cached-input cost + Output-token cost + Other usage charges
Then:
Blended cost per 1M tokens = Total API cost ÷ Total tokens × 1,000,000
Many token-based services distinguish among input, cached input, and output tokens instead of charging one uniform rate. OpenAI’s current documentation, for example, treats these as separate usage categories.
Do not compare only the advertised input-token rate. The output mix can materially change the bill.
For Owned AI Infrastructure
Owned hardware requires a fuller equation:
Cost per 1M tokens = Period TCO ÷ Useful tokens produced during the period × 1,000,000
Period TCO can include:
Hardware + financing + power + cooling + facilities + networking + storage + software + support + staffing + operations + spares − residual value
This approach prevents a common mistake: treating the GPU purchase as the entire cost while ignoring the systems required to keep it productive.
For Cloud or Neocloud GPU Capacity
For infrastructure rented by time:
Cost per 1M tokens = Total rental and operating cost ÷ Useful tokens produced × 1,000,000
Measure real token throughput under representative concurrency and latency requirements. A theoretical peak number can make a cost model look much better than the production workload will deliver.
NVIDIA’s current NIM benchmarking guidance shows why. Total system tokens per second can rise as concurrent requests increase, but only until available GPU resources become saturated; throughput can then flatten or decline.
Input-Token vs. Output-Token Costs
Input tokens are the tokens sent into the model. They include prompts, system instructions, retrieved context, conversation history, and other data included in the request.
Output tokens are the tokens generated by the model.
They should be tracked separately for three reasons.
First, many APIs charge different rates for input and output tokens.
Second, workload ratios vary. A document-classification workload may consume a long input and return a short answer. Code generation or report writing may produce much more output.
Third, prompt processing and token generation are not identical performance phases. Modern LLM benchmarks track measures such as time to first token and output-token generation rate because user experience and system throughput depend on both.
A useful planning formula is:
Total token cost = (Input tokens × input rate) + (Output tokens × output rate) + applicable cached or other usage costs
For owned infrastructure, teams should still record the input-to-output ratio even without an API invoice. It helps explain why two applications running the same model can produce different throughput and capacity needs.
Training Cost vs. Inference Cost
Training and inference both consume AI infrastructure, but they should not share one cost model.
| Factor | Training | Inference |
| Main economic unit | Cost per training run, training token, checkpoint, or model outcome | Cost per request, output token, or useful token |
| Workload pattern | Planned jobs and defined runs | Continuous, scheduled, or burst traffic |
| Primary performance focus | Throughput and time to complete training | Throughput plus latency and concurrency |
| Capacity planning | Often known before a run begins | Must respond to changing user demand |
| Utilization challenge | Keeping a large job efficiently fed | Balancing idle capacity against traffic peaks |
| ROI question | What did it cost to create or improve the model? | What does it cost every time the model is used? |
AWS describes training workloads as generally more predictable and throughput-oriented, while inference introduces more dynamic demand, latency requirements, and resource-management challenges. Google Cloud’s accelerator benchmarking guidance likewise separates training measurements from inference measures such as time to first token, inter-token latency, and generated tokens per second.
That difference matters financially.
A major training run is expensive, but it ends. Production inference may continue every hour of every day as AI becomes part of customer service, coding, search, agents, analytics, or other business processes.
Crusoe also argues that inference has become the dominant workload across consolidated cloud environments in 2026. That should be treated as the company’s market view rather than a universal measurement for every organization, but it reflects a broader shift toward sustained production AI.
How GPU Utilization Changes Cost per Token
GPU utilization is one of the most important variables in owned-infrastructure economics.
Suppose a GPU cluster has a large fixed monthly cost. That cost exists whether the accelerators produce useful output for most of the day or spend long periods waiting.
When productive utilization falls, the same fixed cost is spread over fewer tokens.
Illustrative Utilization Scenario
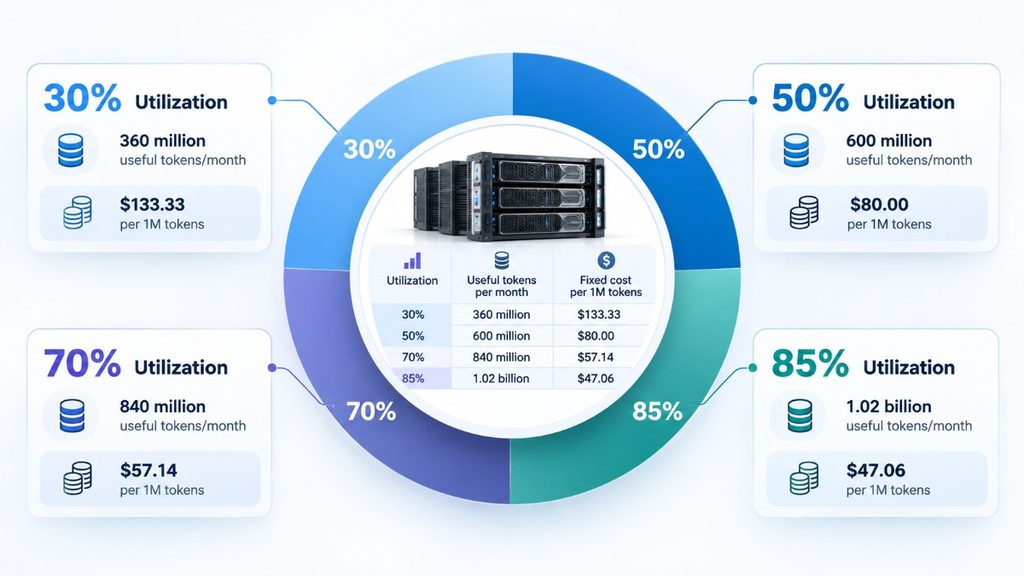
Assume a serving environment has $48,000 in monthly fixed infrastructure cost and can produce 1.2 billion useful tokens per month at the reference workload if productive use reaches 100%.
For illustration, assume token output changes in direct proportion to productive utilization:
| Productive utilization | Useful tokens/month | Fixed cost per 1M tokens |
| 30% | 360 million | $133.33 |
| 50% | 600 million | $80.00 |
| 70% | 840 million | $57.14 |
| 85% | 1.02 billion | $47.06 |
These figures are illustrative assumptions, not universal utilization targets or hardware benchmarks. Real throughput does not always scale in a straight line. Model size, batch size, prompt length, output length, memory limits, serving software, concurrency, and latency targets all affect the curve.
MLCommons’ current endpoint benchmark framework shows the same basic trade-off: increasing concurrency can raise total system throughput until the system approaches its throughput limit, while per-user responsiveness may decline.
This is why infrastructure teams should measure productive utilization, not just whether a monitoring tool reports that the GPU is busy.
Networking can also leave accelerators waiting for data or synchronization. The relationship between fabric performance and GPU idle time makes AI data center network cost optimization part of the cost-per-token calculation, not a separate networking issue.
Do Not Optimize Utilization at the Expense of Latency
Higher utilization is useful only while the infrastructure still meets the workload’s service target.
Pushing more requests onto the same GPUs can increase total throughput. It can also increase queue time, time to first token, or the delay between generated tokens.
That creates a practical boundary:
The lowest cost per token is not automatically the best result if users cannot tolerate the latency.
Measure token economics at a stated service level, such as:
- target time to first token;
- required output rate per user;
- P95 or P99 latency;
- concurrency;
- model accuracy or quality threshold;
- context length; and
- uptime requirement.
This makes comparisons fair. Otherwise, one design may appear cheaper simply because it provides a lower level of service.
What Belongs in True AI Infrastructure TCO?
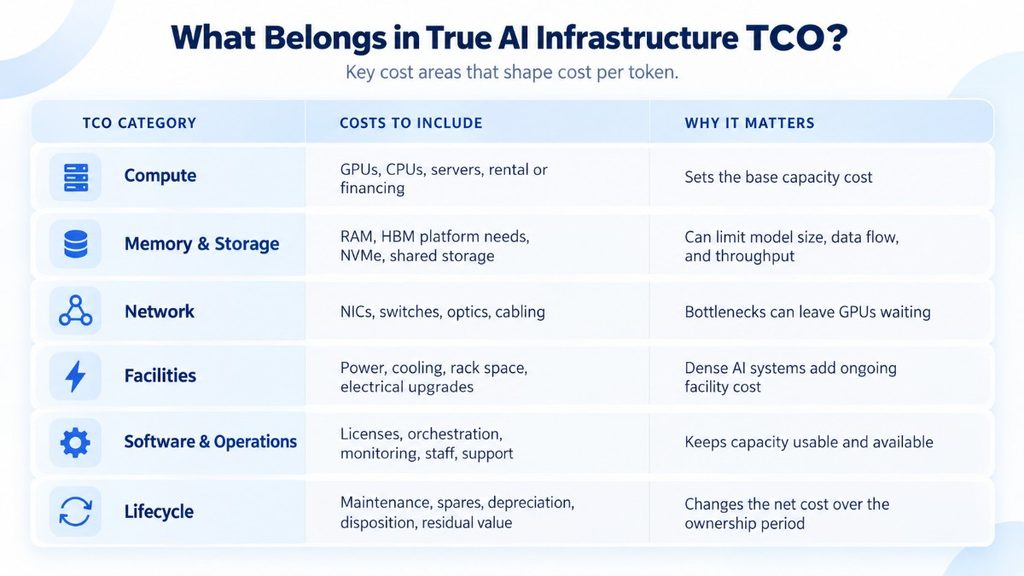
A useful cost-per-token model should account for the complete bill of materials and operating model.
| TCO category | Costs to include | Why it can change token economics |
| Compute | GPUs, CPUs, servers, rental or financing | Sets the basic capacity cost |
| Memory and storage | RAM, HBM-related platform needs, NVMe, shared storage | Can limit model size, data flow, and throughput |
| Network | NICs, switches, optics, cabling | Bottlenecks can leave GPUs waiting |
| Facilities | Power, cooling, rack space, electrical upgrades | Dense AI systems create ongoing facility cost |
| Software and operations | Licenses, orchestration, monitoring, staff, support | Required to keep capacity usable and available |
| Lifecycle | Maintenance, spares, depreciation, disposition, residual value | Changes the net cost over the ownership period |
This is where BOM design becomes important. A GPU server that looks affordable on paper may require additional memory, NICs, optics, power supplies, rack changes, or cooling work before it reaches production.
Teams designing their own platforms can use GPU server build requirements and supporting components to identify costs that a GPU-only estimate can miss.
Residual value should also be included rather than automatically setting the hardware’s end value to zero. The actual value will depend on generation, condition, configuration, demand, support status, timing, and the path for reuse or resale.
Cloud, Neocloud, Owned New, or Owned Secondary: Use the Same Economic Unit
Cost per token becomes especially useful when deployment models are different.
Cloud API: Low infrastructure responsibility and high elasticity can make cloud attractive for variable usage, experimentation, or workloads that need access to advanced managed models. Cost rises with token consumption.
Neocloud or rented GPU infrastructure: Dedicated AI capacity can provide more control over hardware and performance, but utilization, contract terms, support, networking, and capacity commitments still affect economics.
Owned new infrastructure: Higher upfront capital can work well for sustained and predictable workloads when utilization is strong and the organization has suitable facilities and operations.
Owned secondary or previous-generation infrastructure: Acquisition cost may be lower and availability may improve the business case for some workloads. It is not automatically the best choice. Condition, provenance, testing, warranty, compatibility, firmware, software support, and remaining lifecycle value must be verified.
The right answer often uses more than one model. A team may keep steady inference on owned infrastructure while using cloud or rented capacity for bursts, specialized models, or temporary training demand. The financial trade-offs behind this approach align with Catalyst’s on-prem, cloud, and hybrid cost comparison.
AMD’s Tokenomics Calculator takes a similar modeling approach by comparing token volume, cloud-only execution, local execution, hybrid mixes, TCO, monthly cost, and break-even over several time periods. AMD also makes clear that its results are estimates and depend on workload and pricing assumptions.
A Practical Cost-per-Token Worksheet

A useful worksheet can be built from eight inputs.
1. Define the workload
Record:
- model and model size;
- training, fine-tuning, RAG, batch inference, or real-time inference;
- expected users;
- peak and average concurrency;
- context length;
- average input tokens;
- average output tokens;
- latency target; and
- expected growth.
Do this before choosing the infrastructure.
2. Measure token demand
Track actual or projected:
Monthly input tokens + monthly output tokens + cached/reused token volume
Do not rely only on user count. Two groups with the same number of users may have very different token consumption.
3. Benchmark representative workload performance
Measure the actual model on the target hardware or service.
Useful measures include:
- tokens per second per system;
- tokens per second per user;
- time to first token;
- inter-token latency;
- maximum acceptable concurrency; and
- quality or accuracy at the selected model settings.
A product specification alone is not enough. Even a detailed NVIDIA H100 PCIe performance and use-case review must eventually be matched to the actual model, serving stack, and workload.
4. Calculate the full cost base
Include hardware or service charges plus power, cooling, networking, storage, software, support, staff, financing, and other required costs.
For owned assets, subtract a reasonable residual-value assumption where justified.
5. Calculate blended cost per token
Use:
Blended cost per 1M tokens = Total period cost ÷ Total tokens processed × 1,000,000
Then calculate input and output economics separately where the data allows.
6. Add a “useful output” measure
A token can be cheap but still provide poor economic value if the generation is rejected, repeated, or unusable.
Catalyst’s suggested decision lens is to also ask:
Cost per useful output = Total AI cost ÷ accepted workload output
This is not a universal accounting standard. It is a practical way to connect infrastructure efficiency with workload success.
For example, an AI application that generates large amounts of cheap output but requires constant retries may have a worse business result than a more expensive model that completes the task correctly on the first attempt.
7. Run sensitivity tests
Recalculate the economics at different:
- utilization levels;
- input/output ratios;
- user counts;
- cloud rates;
- power costs;
- hardware terms;
- workload growth rates; and
- residual values.
The answer should be a range, not one perfect forecast.
8. Compare deployment options on the same assumptions
Keep model quality, workload volume, latency, and analysis period consistent.
Only then compare cloud, neocloud, owned new, owned secondary, lease, or hybrid alternatives.
When Can a “Cheaper” GPU Produce More Expensive Tokens?
A lower hardware price can lose its advantage when it creates costs elsewhere.
Before locking a GPU SKU, verify:
- Can it hold the required model and context in memory?
- What throughput does it deliver with the real model?
- What happens at peak concurrency?
- Can the server feed the GPUs without CPU, memory, storage, or network bottlenecks?
- What power and cooling changes are required?
- Is the software stack fully supported?
- How much productive utilization can the workload sustain?
- What support or spare strategy is required?
- What useful residual value may remain at refresh?
That is the decision boundary Catalyst should own: not “new is better” or “secondary is cheaper,” but which infrastructure produces the required AI output at the best full-lifecycle economics.
Want to know your true cost per token? Connect with Catalyst Data Solutions Inc. for a workload and BOM review to uncover hidden TCO gaps.
That review is most useful when it starts with workload data and exact infrastructure requirements rather than a predetermined GPU choice.
Common Cost-per-Token Mistakes
Avoid these errors when building an AI ROI model:
- Using GPU purchase price as TCO. The accelerator is only one part of the stack.
- Using peak tokens-per-second as expected production throughput. Benchmark the real model at the required service level.
- Ignoring idle capacity. Fixed infrastructure costs continue when GPUs wait.
- Combining input and output usage without checking the mix. Their economics can differ.
- Comparing different quality levels. A cheaper model or configuration is not equivalent if it fails the workload requirement.
- Treating training and inference as the same cost problem. Their operating patterns differ.
- Assuming owned hardware has zero end value. Residual value should be estimated where a viable reuse or resale market exists.
- Ignoring the rest of the BOM. Memory, storage, NICs, switches, optics, power, cooling, software, and support can change both throughput and cost.
The Better AI ROI Question

Cost per token does not replace every infrastructure metric. GPU-hour, power draw, utilization, latency, throughput, CapEx, and OpEx still matter.
What cost per token does is connect those inputs to an economic output.
For finance, that provides a better unit for evaluating AI spending. For infrastructure teams, it exposes the effect of utilization and bottlenecks. For procurement, it makes it easier to compare different hardware generations and sourcing models without assuming the newest or cheapest option will win.
The most useful calculation is therefore not simply:
“How much does this GPU cost?”
It is:
“At our workload, utilization, service level, and lifecycle assumptions, what will each million useful tokens actually cost us?”
That is the number that turns AI infrastructure from a hardware purchase into a measurable business case.
Frequently Asked Questions
1. What is a good cost per token for an AI workload?
There is no universal “good” cost per token. The right target depends on the model, workload, response quality, latency requirement, traffic volume, and deployment method. A useful benchmark is your own cost per token over time and the cost of alternative infrastructure that can meet the same service and quality requirements.
2. How often should a business recalculate its AI cost per token?
Recalculate it whenever workload volume, model choice, infrastructure, cloud pricing, power cost, or utilization changes materially. For production AI, a monthly or quarterly review can help teams spot rising costs, unused capacity, and changes in the break-even point between cloud and owned infrastructure.
3. Can model quantization reduce cost per token?
Yes, in some workloads. Quantization can reduce the memory and compute needed to run a model, which may allow more requests on the same hardware or make lower-cost infrastructure practical. However, teams should test model quality, latency, throughput, and software compatibility before assuming that a smaller precision format will reduce total cost.
4. How do prompt caching and repeated context affect token economics?
Prompt caching can lower costs when an application repeatedly sends the same instructions or context. It can also reduce repeated processing work. The financial benefit depends on the provider or serving architecture, cache hit rate, prompt size, and how often the same content is reused.
5. How can companies compare cost per token across different AI providers?
Use the same model task, input size, output size, quality target, latency requirement, and expected monthly volume for each option. Include API fees, reserved capacity, data transfer, support, and other required costs. Comparing advertised token prices alone can be misleading when providers deliver different performance, service levels, or model quality.